SMART BY DESIGN
  • About
    • The Project
    • Target Groups
    • Outputs
    • Partners
  • Activities
  • Resources
    • Outputs >
      • MAP Smart & Digital Disruptions
      • Modules for Smart City Innovation
    • Case Studies
  • Blog & News
    • Newsletters
  • Contact

How to map out the smart city disruption

4/29/2020

Comments

 
Smart city disruption map
The SMART project is aimed at developing new competencies of the SMEs managers to manage deep-tech businesses in one very fast-growing market - the smart cities. The penetration of so-called smart city technologies results in the creation of new markets and requirements for new skills. On the basis for the achievement of this purpose is laid the map of digital smart disruptions.
​

This short article explains some important terms and the approach implemented in this project.
​

What is a map of digital and smart disruptions (in the context of smart cities)?

The picture is worth a thousand words - Fred R. Barnard.
​
The map of digital and smart disruptions provides an easy for understanding and learning overview and analysis of how digital and disruptive technologies (innovations) do shape the smart city concept. The map includes the results generated by the focus group and corrected later by the partners with the results from the research on the technologies advances, level of change and impact, performance, purpose, and fit.

The map is a two-dimensional cross factorial analysis matrix made with different instruments in diverse forms (Fig.1). 
mapping the disruptive smart city technologies
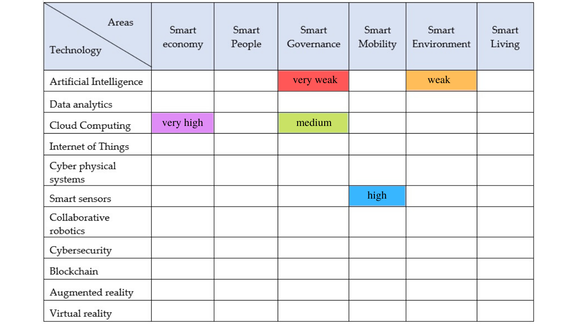
Fig.1. Mapping the disruptive smart city technologies (the filled areas are only exemplary)
The ultimate purpose of a map is to improve the scenario planning of businesses and the cities in the process of their transformation into smart cities and to point out the opportunities for involvement of the businesses in the process. So, this can be treated as a sample of an opportunity map for every city in the process of urban management and for every company in the process of innovation management.

In the case of the project SMART, the map will present the results of the studies and research of the project partners in a systematic and simplified way, based on:
  1. the conclusion and definition of the smart city’ technologies that might be a source for disruptive innovations in the main city’s areas. Every identified technology can be studied in regard to the market, product/service, delivery methods, production model and business model.

  2. the conclusion and presentation of what the main smart city’s areas are, where the process of transformation is carried out, what their needs are, barriers and stimulations for smart technologies implementations;

  3. the level of penetration of the smart city’ technologies into the smart city’s areas - the less level of penetration the less-differentiated business opportunities can be generated for applications in the near future. On the other hand, more deep-tech smart city applications are possible in the cities with a higher level of penetration of such technologies;
    ​
  4. the opportunities for the businesses and impact of these technologies and their application for the business growth and the cities transformation. The map has a digital format and encompasses all potential companies including start-ups and corporates which work or would like to move to the smart city segment.
​

What is a disruptive smart city technology?

The definition of the disruptive innovation given by Clayton Christensen is the innovation that creates a new market and value network and eventually disrupts an existing market and value network, displacing established market-leading firms, products, and alliances. The following benefits and changes coming from the disruptive innovations are identified:
  • everything that could be digital will become digital, technology will be embedded widely in products and services in a near term;
  • customers look for high levels of personalization and individual approach and service;
  • subscription-based business models and pay-per-click are rising;
  • shortened product life cycle - on the one hand, the pace at which new products are adopted (number of years until x % penetration has been reached) increases. On the other hand, product life cycles are shortening. With technology products even to three or six months. For SMEs that invest and develop digital innovations the revenue stream is generated by products launched within the previous years.
  • the use is replacing possessions - very often customers prefer to use the product, rent it or pay only for the time if using it.

Following this definition, it is easy to presume that in general the “disruptive smart city technology” is any kind of emerging, advanced & digital (but not only) technology that can generate disruptive innovations creating benefits and many changes in the context of an urban (territorial) area and if this process is well managed it should result in a better life of the citizen.

​

What does the process of mapping the smart city disruption mean? 

The mapping is a structured process, focused on a topic or construct of interest, involving input from many participants, that produces an interpretable pictorial view (concept map) of their ideas and concepts and how these are interrelated. The mapping helps partners to think more effectively as a group without losing their individuality. It helps the project group to manage the complexity of the vision on the smart city disruptive technologies without trivializing them or losing detail.

The mapping process is one of the portfolios of many other similar methods that management and social scientists have developed like brainstorming, brainwriting, nominal group techniques, focus groups, affinity mapping, Delphi techniques, facet theory, and qualitative text analysis. The mapping process is focused on the major shifts from the business perspective and how these changes will affect the growth.

It uses focus groups to understand and analyse the impact of smart city technologies and their application for business growth. The trends, types of technology, and levels of transformation are included in studying within the process. Consequently, the project partners have to study a framework of the following five dimensions of these technologies:
  • market - customer segments, citizens’ participation, needs, behaviours, trends;
  • products and services - user experience, brands, product features, functionalities;
  • delivery methods - supply chains, delivery models for online and offline business;
  • production model - co-creation, co-development, production technologies, facilities, software, hardware, HR, etc.;
  • business model - how revenue and cost models look like, what partnerships are developed, how public-private partnerships work, and what best practices are in place in terms of innovation.

The study includes the level of impact and change of the emerging technologies - so, what does exist now and what is the current maturity level (according to Gartner).
​
smart city disruptive technologies

What stages does the process of mapping include in a focus group? 

The process is placed in a focus group that is facilitated by the leader of the mapping process. A mapping process in a such group involves five steps that can take place in a period of time, planned for the output and depending on the project development situation.
​
  1. The first step is preparation of the focus group. There are three things to be done here. The leader of the mapping process identifies who the participants will be in the focus group. It is a relatively small group of participants from the stakeholders involved (8-10 persons). Then, the leader works with the participants to develop the focus for the project. In this case, the group is focused on defining what the smart city disruption technologies are and on choosing what challenges (problems) areas to map (prognosis) in all of the outcomes (impacts) they might expect to be seen as a result.

  2. In the second step (generation step) the participants in the focus group develop a large set of statements that address this focus. They generate statements that describe the advanced technologies that are currently used in smart city areas and mark what is their level of penetration. They also generate statements describing specific outcomes that might occur as a result of the implementation of these technologies. A wide variety of methods can be used to accomplish this including traditional brainstorming, and so on.

    The group will generate finally many and diverse statements for possible current and future applications of smart disruptive technologies in smart cities, answering the following questions:
    - What of the city’s challenges (problems) do you know as already resolved based on the defined in the first stage smart city disruptive technologies?
    - What other challenges (problems) could be resolved with the smart city disruptive technologies in the cities of future?

  3. In the third, the structuring step, the participants select and sort the statements into groups (clusters) of similar ones, and every participant rate each of the statements on some scale for their relative importance and level of penetration of the technologies in the respective areas, from the 1-to-5 scale. In this stage, the group can use the results from facts finding and studies that are already in place done by the project partners. The participants in the group can receive, use, and interpret the gathered reports, analyses, and the open access papers on emerging & smart disruptive technologies and their use before the final evaluation (scoring).

  4. The fourth, the representation stage is where the analysis is done - this is the process of taking the sort and rating input and “representing” it in a matrix form. Every group of similar statements and received scoring on the level of penetration will be located in a proper and logically defined field of the matrix. So, every area in the result will be filled or empty. The empty fields will have to be analysed in-depth and the marked field will have a group of statements that well describe the current and future situation of the smart city disruptive technologies and their possible impact.
    ​
  5. Finally, the utilization and interpretation step involves the use of the map to help address the original focus. On the programme side, the maps can be used as a visual framework to prove the results of the analyses and the reports that the partners have generated or for their possible improvements. The map can be used for developing measures and displaying results and for further analyses and planning when a scenario approach is needed. The interpretation is easy. The empty or low-level evaluated areas, if they are not resulting in a lack of competences and information, will generate opportunities for the business to proactive product/services development, investing in R&D and for upskilling new talents.

​
Author
KISMC
Comments

    Author

    Smart by Design

    Archives

    September 2021
    March 2021
    February 2021
    January 2021
    December 2020
    November 2020
    October 2020
    September 2020
    August 2020
    July 2020
    June 2020
    April 2020
    February 2020

    Categories

    All
    Artificial Intelligence
    Augmented Reality
    Blockchain
    Burgas Smart City
    Cloud Computing
    Collaborative Robotics
    Cyber-physical Systems
    Cybersecurity
    Data Analytics
    Digital Transformation
    Disruptive Technologies
    Good DX Practices From Bulgaria
    Smart Cities
    Smart City Application
    Smart City Technologies
    Sofia Smart City
    Varna Smart City
    Virtual Reality

    RSS Feed

Picture
The SMART by Technologies Design project [SMART by Design] Project No. 2019-1-BG01-KA202-062298​ has been co-funded by the Erasmus+ Programme of the European Union. 

This website reflects the views only of the author, and the European Commission cannot be held responsible for any use which may be made of the information contained therein

SMART BY DESIGN

​​Home
About
​The Project
Target Groups
Outputs
​Partners


​

SUPPORT

Activities
Resources
Blog & News
Newsletters
​Contact

​

    Subscribe now for our project partners newsletter:

Subscribe to Newsletter


​Copyright ®2020 SMART BY DESIGN. All rights reserved.
  • About
    • The Project
    • Target Groups
    • Outputs
    • Partners
  • Activities
  • Resources
    • Outputs >
      • MAP Smart & Digital Disruptions
      • Modules for Smart City Innovation
    • Case Studies
  • Blog & News
    • Newsletters
  • Contact